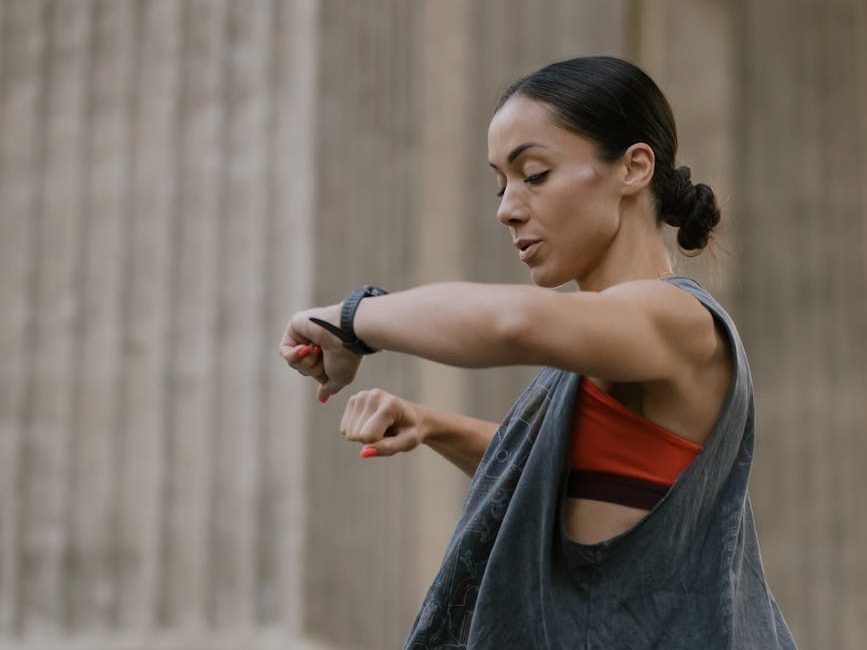
- 10 Fitness Tracker Metrics Explained: What Your Numbers Mean
- Fitness Tracker Metrics at a Glance
- Fitness Metric #1: Steps Count and Daily Activity
- Fitness Metric #2: Heart Rate (Resting & Active)
- Fitness Metric #3: Calories Burned
- Fitness Metric #4: Sleep Duration & Quality
- Fitness Metric #5: Heart Rate Variability (HRV)
- Fitness Metric #6: Blood Oxygen Levels (SpO2)
- Fitness Metric #7: VO2 Max & Cardio Fitness Score
- Fitness Metric #8: Exercise & Workout Metrics
- Fitness Metric #9: Stress Tracking
- Fitness Metric #10: Recovery Metrics & Readiness Scores
- Which Fitness Tracker Metrics Should You Actually Pay Attention To?
- Can You Trust Fitness Tracker Data?
- Fitness Tracker Metrics by Device
- How to Interpret Fitness Tracker Data
- The Best Smartwatch for Fitness Metrics: Garmin vívoactive® 6
10 Fitness Tracker Metrics Explained: What Your Numbers Mean
A few years ago, fitness trackers were mostly glorified pedometers. Today, they’ve evolved into sophisticated health companions that can measure everything from your heart rate to your recovery readiness. But here’s the catch: while these devices provide a flood of data, most people don’t really know what to do with it. The truth is, fitness tracker data is only useful if you understand what the numbers mean and how to apply them to your lifestyle. That’s why we’re going to break down the 10 most common fitness tracker metrics, what they measure, why they matter, and how you can use them to improve your health and fitness.
Fitness Tracker Metrics at a Glance
| Metric | What It Measures | Best For | Trust Level |
|---|---|---|---|
| Steps & Activity | Daily movement volume | General activity awareness | High (for trends) |
| Heart Rate | Beats per minute, resting & active | Cardio fitness, training zones | High |
| Calories Burned | Estimated energy expenditure | Rough trend, not precise dieting | Low |
| Sleep Duration & Quality | Time asleep, sleep stages | Recovery, hormone health | Moderate |
| Heart Rate Variability (HRV) | Variation between heartbeats | Stress, recovery readiness | Moderate–High |
| Blood Oxygen (SpO2) | % oxygen saturation in blood | Altitude training, sleep flags | Moderate |
| VO2 Max / Cardio Score | Estimated aerobic capacity | Long-term fitness tracking | Moderate |
| Workout Metrics (pace, cadence, etc.) | Exercise-specific performance data | Training refinement | High |
| Stress Tracking | Estimated stress load | Awareness, not diagnosis | Low–Moderate |
| Recovery/Readiness Score | Composite daily readiness | Training/rest decisions | Moderate |
Use this table as your starting map. Below, we break down every metric using a consistent format — what it is, why it matters, how your tracker measures it, and exactly what to do with the number once you have it.
Fitness Metric #1: Steps Count and Daily Activity
What it is: Most fitness trackers measure how many steps you take each day, and many also estimate how much time you spend sitting versus moving.
Why it matters: Step count is a simple but powerful indicator of your overall activity level. A landmark study following over 2,100 middle-aged adults found that those taking at least 7,000 steps per day had a 50–70% lower risk of premature mortality compared to those taking fewer than 7,000 steps, regardless of how intensely they walked. Step intensity showed no additional benefit once total volume was accounted for — volume, not speed, was what mattered. ¹
How it’s measured: Trackers use an accelerometer (a motion sensor) worn on the wrist or attached to your body to detect the repetitive motion pattern of walking or running, converting that motion into a step count via an algorithm.
What to do: Instead of obsessing over the magic 10,000 number — which, incidentally, originated from 1960s Japanese pedometer marketing rather than scientific research — use your step count as a personal baseline. If you’re currently averaging 4,000 steps per day, try increasing it to 5,000 or 6,000. Little adjustments like taking the stairs, walking during phone calls, or parking farther away can add up quickly.
Fitness Metric #2: Heart Rate (Resting & Active)
What it is: Devices measure your heart rate continuously using optical sensors, giving you insights into your resting heart rate (RHR), exercise intensity, and recovery.
Why it matters: Your resting heart rate is a good indicator of cardiovascular fitness. According to the American Heart Association, a normal RHR ranges from 60 to 100 beats per minute, with lower rates often indicating better cardiovascular conditioning. Active heart rate monitoring helps you train in specific heart rate zones, which is critical for improving endurance and burning fat efficiently.
How it’s measured: Most consumer trackers use photoplethysmography (PPG) — a green or infrared light that shines into your skin and measures blood flow changes to calculate your pulse. This is among the more accurate metrics wearables provide; validation studies have found mean absolute percentage errors as low as 3.77–4.73% for wrist-based heart rate sensors compared to medical-grade ECG monitors. ²
What to do:
- Track your resting heart rate over time. If it’s trending downward, your fitness is improving.
- Use heart rate zones for smarter training. Zone 2 (roughly 60–70% of your max HR) is great for endurance building, while higher zones improve speed and VO2 max.
- Pay attention to recovery heart rate — how quickly your heart rate drops after exercise. Faster recovery often means better fitness.
Fitness Metric #3: Calories Burned
What it is: Many fitness trackers estimate calories burned based on your activity, movement, and heart rate data, combined with your body weight and a standardized metabolic formula.
Why it matters: Knowing your calorie burn can help with weight management, but this is the metric where you should trust the numbers least. The definitive study on this topic, conducted at Stanford University, tested seven popular wrist-worn devices against gold-standard laboratory measurement (indirect calorimetry). While heart rate accuracy was strong across devices, energy expenditure estimates were consistently unreliable — the best-performing device was still off by an average of 27%, and the worst was off by 93%. ³
How it’s measured: Trackers combine your heart rate, movement data, and body metrics with population-average metabolic equivalent (MET) tables to estimate energy expenditure. Because these tables are built from group averages, they don’t account for your individual metabolic rate, muscle mass, or aerobic efficiency — which is the core reason accuracy suffers.
What to do: Think of calorie tracking as a trend tool, not an exact science. Compare your daily calorie burn estimate with your food intake to see whether you’re trending toward a surplus (relevant for muscle gain) or a deficit (necessary for fat loss) — but don’t rely on the specific number as precise data. Pair it with how your body feels and how your weight is trending over weeks, not days.
Fitness Metric #4: Sleep Duration & Quality
What it is: Sleep tracking uses motion sensors and, on more advanced devices, heart rate variability to estimate how long you sleep and break it down into stages like light, deep, and REM sleep.
Why it matters: Sleep is the foundation of recovery, hormone regulation, and performance. A multidisciplinary expert panel convened by the National Sleep Foundation, using a formal consensus methodology, established that 7–9 hours of sleep per night is appropriate for healthy adults, with anything under 6 hours associated with a meaningfully elevated risk of adverse health outcomes. ⁴
How it’s measured: Most trackers combine accelerometer-based motion detection with heart rate and HRV patterns to estimate sleep stages. A systematic review comparing several popular consumer devices (Fitbit Charge 4, Garmin Vivosmart 4, and WHOOP) against polysomnography — the clinical gold standard — found that overall sleep/wake detection was reasonably accurate, but specific sleep-stage breakdowns (light vs. deep vs. REM) showed more device-to-device variability. ⁵
What to do: Use your tracker to identify patterns, not perfection. If your data shows you’re consistently sleeping only six hours, that’s a signal worth acting on — even if the exact minute-by-minute stage breakdown isn’t perfectly precise. Look for insights like whether late-night screen time or alcohol is affecting your deep sleep, and align your habits with the trend data over time.
Fitness Metric #5: Heart Rate Variability (HRV)
What it is: HRV measures the tiny, natural differences in time between your heartbeats. Despite sounding technical, it’s one of the most powerful metrics for understanding stress and recovery.
Why it matters: A higher HRV generally indicates a well-recovered autonomic nervous system; lower HRV can signal fatigue, stress, illness, or overtraining. A comprehensive review of HRV research describes it as a non-invasive, real-time readout of the balance between your sympathetic (“fight or flight”) and parasympathetic (“rest and digest”) nervous systems, making it a genuinely useful — though imperfect — window into overall physiological state. ⁶
How it’s measured: Wrist- and finger-worn devices calculate HRV using the same PPG heart rate sensor, analyzing beat-to-beat interval variation, usually during sleep when motion artifacts are minimal.
What to do: Monitor your HRV trend over weeks, not daily fluctuations, which are normal and often meaningless in isolation. If your HRV is consistently lower than your personal baseline, it may be a signal to dial back intense training and focus on recovery strategies like sleep, hydration, and stress management.
Fitness Metric #6: Blood Oxygen Levels (SpO2)
What it is: Some newer fitness trackers measure blood oxygen saturation, also known as SpO2, using red and infrared light sensors.
Why it matters: Normal SpO2 levels are typically between 95% and 100%. Low readings could indicate breathing issues, poor sleep quality, or the natural effects of high altitude. The American Lung Association notes that SpO2 monitoring can provide general insight into respiratory health, though consumer devices are not diagnostic tools.
How it’s measured: Using the same optical sensor family as heart rate monitoring, devices shine red and infrared light through the skin and measure how differently oxygenated versus deoxygenated blood absorbs each wavelength. Because this requires a very stable, low-motion signal, most devices only take reliable SpO2 readings during sleep.
What to do: Athletes training at altitude can use SpO2 trends to see how their body is adapting over days. For everyday use, occasional dips might be worth noting as a prompt to check in on sleep quality or discuss any concerns with a healthcare professional — but isolated readings shouldn’t be treated as a medical result.
Fitness Metric #7: VO2 Max & Cardio Fitness Score
What it is: VO2 max is an estimate of the maximum amount of oxygen your body can use during intense exercise. It’s considered one of the best available indicators of cardiovascular fitness.
Why it matters: Higher VO2 max values are consistently linked to improved endurance and significantly reduced risk of all-cause and cardiovascular mortality. Research describes cardiorespiratory fitness, as measured by VO2 max, as a strong and independent predictor of both disease-specific and all-cause mortality — genuinely one of the most powerful longevity metrics available. ⁷
How it’s measured: True VO2 max requires lab-based gas exchange analysis during maximal exertion. Wearables instead estimate it using algorithms based on your heart rate response to submaximal effort, pace, and personal data. A 2025 validation study of Apple Watch’s VO2 max estimate found a mean absolute percentage error of 13.31% compared to laboratory-measured VO2 max — a meaningful gap, though still useful for tracking your own trend over time.
What to do: Use your tracker’s cardio fitness score as a personal benchmark rather than a precise clinical value. As you increase endurance training, you should see your estimated score trend upward over months. Compare your score against age and gender population averages to set realistic, motivating goals — but treat the exact number with appropriate skepticism. Once you know your fitness tracker’s VO₂ max estimate, the next step is figuring out what it actually means for you — see the best VO₂ max standards by age to find out whether your score is average, excellent, or elite.
Fitness Metric #8: Exercise & Workout Metrics
What it is: Beyond the broader health metrics, fitness trackers collect a wide range of workout-specific data: pace, distance, cadence, elevation, and often GPS maps of your runs or rides.
Why it matters: These numbers help you fine-tune your training with much greater precision than the broader health metrics above. Runners can track pace and cadence to identify injury risk factors, while cyclists can monitor elevation and distance to structure performance goals.
How it’s measured: GPS chips track location and distance; accelerometers and gyroscopes detect cadence and movement patterns; barometric altimeters measure elevation change. These sensor types are generally the most mature and accurate technology in any given tracker, since they don’t rely on estimating internal physiology the way calorie or VO2 max metrics do.
What to do: Instead of just logging workouts and moving on, review your data afterward. Did your pace stay consistent? Was your cadence steady throughout? Over time, analyzing these session-specific details can help you train smarter, spot early injury warning signs, and improve faster.
Fitness Metric #9: Stress Tracking
What it is: Some fitness trackers estimate stress by combining heart rate variability, breathing rate, and, on select devices, galvanic skin response (skin conductivity).
Why it matters: Chronic stress affects everything from workout recovery to long-term mental and cardiovascular health. Stress is a well-documented contributor to long-term health problems, and having an objective, if imperfect, daily signal can raise awareness that a purely subjective sense of stress often misses.
How it’s measured: Stress scores are typically derived algorithmically from HRV and heart rate patterns — inheriting both the usefulness and the measurement uncertainty of those underlying metrics. Because “stress” as a physiological state is complex and highly individual, these scores tend to be the least standardized metric across brands.
What to do: If your tracker shows consistently high stress scores, take it as a prompt — not a diagnosis — to incorporate stress management into your routine. Practices like breathing exercises, short walks, and mindfulness meditation can help regulate the underlying HRV and heart rate patterns these scores are built on.
Fitness Metric #10: Recovery Metrics & Readiness Scores
What it is: One of the most recent advancements in fitness trackers is the recovery or readiness score — a composite metric combining sleep, heart rate variability, activity load, and sometimes body temperature into a single daily rating.
Why it matters: Instead of guessing whether you should push hard or take it easy, readiness scores attempt to provide a data-informed guide. Companies like WHOOP and Oura popularized this approach. A qualitative study of regular exercisers using readiness/recovery scores found that these composite metrics genuinely influenced training decisions and were valued by users as a form of “autoregulation” — adjusting workout intensity to match daily physiological readiness rather than a fixed plan. ⁸
How it’s measured: Readiness algorithms are proprietary to each brand, but they generally weight HRV and sleep quality heavily, layering in resting heart rate trends and recent training load. Because these are composite scores built from several individually imperfect metrics, they inherit compounded uncertainty — useful as a general signal, but not a precise instruction.
What to do: Check your readiness score in the morning as one input — not the only input — when planning your workout. If your tracker suggests low readiness and you also feel run down, that’s a strong signal to scale back. If it suggests high readiness but your body feels off, trust how you feel. The score works best as a conversation starter with your own body, not a final verdict.
Which Fitness Tracker Metrics Should You Actually Pay Attention To?
Here’s something most fitness tracker guides won’t tell you directly: monitoring all 10 metrics doesn’t make your training better. In fact, for most people, tracking everything simultaneously creates data overload that leads to less action, not more. You end up checking numbers without a clear sense of what to actually change.
A more effective approach is choosing 3–5 metrics tied specifically to your current goal, and largely ignoring the rest until that goal shifts.
For Weight Loss, Focus On:
- Steps & daily activity — the most reliable, lowest-noise indicator of overall movement
- Sleep duration — poor sleep disrupts hunger hormones and undermines every other effort
- Workout metrics (pace/effort) — to ensure training intensity is actually progressing
- (Optional) Calorie burn — only as a rough trend, never as a precise dieting tool
For Building Endurance:
- Heart rate zones — to train at the right intensity for adaptation
- VO2 max / cardio score — your primary long-term progress marker
- Recovery/readiness score — to avoid overtraining while building volume
- Workout metrics (pace, cadence) — for session-by-session refinement
For Stress Management & Recovery:
- HRV — the most physiologically grounded recovery signal available
- Sleep quality — directly tied to next-day HRV and stress resilience
- Recovery/readiness score — a synthesized daily check-in
- (Optional) Stress tracking — useful for awareness, least standardized metric on this list
For General Health Awareness (No Specific Goal Yet):
- Steps
- Sleep duration
- Resting heart rate trend
That’s it. Three metrics, checked weekly rather than obsessively daily, will tell you more about your trajectory than ten metrics checked constantly. Add complexity only once you have a specific reason to.
Can You Trust Fitness Tracker Data?
Short answer: it depends heavily on which metric you’re looking at, and accuracy varies for reasons that are largely outside your control.
Why Fitness Tracker Accuracy Varies
Several factors explain why the same device can be excellent at one metric and unreliable at another:
- Measurement method matters. Heart rate is measured directly via optical light absorption — a relatively direct physical signal. Calories, by contrast, are calculated from an algorithm combining heart rate, motion, and population-average metabolic tables — an indirect estimate stacked on top of other estimates, which compounds error.
- Device placement affects signal quality. Wrist-worn optical sensors lose accuracy with loose bands, wrist hair, tattoos, or excessive motion. Finger-worn devices (like Oura) generally get a stronger, cleaner signal because the arteries sit closer to the skin surface there.
- Individual physiology introduces bias. Research comparing four popular wearables during structured cycling found that participants with higher body fat percentage consistently showed greater calorie-estimate error and reduced accuracy across every device tested. Skin tone and skin perfusion can similarly affect optical sensor readings.
- Activity type changes reliability. Devices are generally more accurate during steady-state activities like walking or running than during activities involving a lot of arm movement (like weightlifting) or where the wrist isn’t moving in a representative pattern (like cycling).
Metric Reliability
| Metric | General Reliability | Important Caveat |
|---|---|---|
| Steps | Generally useful for trends | Device placement and activity type matter; wrist devices can misfire on arm-heavy tasks |
| Heart Rate | Often quite accurate (error typically under 5–8%) | Accuracy drops during high-motion activities like cycling or weightlifting |
| Calories | Lowest reliability of any common metric | Errors of 27–93% are documented even in top-performing devices ³ |
| Sleep Duration/Stages | Moderate — overall sleep/wake detection is fairly good | Specific stage breakdowns (light/deep/REM) are less precise than duration |
| HRV | Moderate to high, if measured consistently at the same time daily | Highly sensitive to measurement timing, alcohol, illness, and prior training |
| SpO2 | Moderate | Requires very low motion; most devices only measure reliably during sleep |
| VO2 Max | Moderate | Apple Watch shown to have ~13% mean error vs. lab measurement; useful for trend, not precision |
| Recovery/Readiness Scores | Moderate | Composite scores inherit and compound the uncertainty of their underlying HRV and sleep inputs |
The practical takeaway: trust directional trends over absolute numbers. If your resting heart rate has dropped 5 points over two months, that’s meaningful information even if the exact daily numbers aren’t perfectly precise. If your tracker says you burned exactly 487 calories, treat that as “roughly 350–650,” not a precise figure to plan your dinner around.
Fitness Tracker Metrics by Device
Not every wearable tracks every metric — and coverage has changed significantly even in the past couple of years (WHOOP, for example, resisted step tracking for nearly a decade before adding it in October 2024). Here’s an accurate, verified snapshot of what today’s major devices measure.
Which Fitness Trackers Measure These Metrics?
| Metric | Garmin | Apple Watch | Fitbit | WHOOP | Oura |
|---|---|---|---|---|---|
| Steps | ✓ | ✓ | ✓ | ✓ (added Oct. 2024) | ✓ |
| Heart Rate | ✓ | ✓ | ✓ | ✓ | ✓ |
| HRV | ✓ | ✓ | ✓ | ✓ | ✓ |
| Sleep | ✓ | ✓ | ✓ | ✓ | ✓ |
| SpO2 | Model dependent | Model dependent (Series 6+) | Model dependent (Charge/Sense) | Model dependent (4.0+) | Model dependent (Gen 3+) |
A few notes worth knowing:
- WHOOP spent nearly a decade deliberately excluding step tracking, arguing it was a “less precise” health measure compared to its core Strain/Recovery metrics. It reversed course in October 2024 in response to research and user demand — so older reviews or comparisons claiming WHOOP doesn’t track steps are now outdated.
- SpO2 support is generational, not universal, across nearly every brand. Garmin, Apple Watch, Fitbit, WHOOP, and Oura all gated this feature behind specific hardware versions rather than including it from the start — check your specific model before assuming the feature is available.
- Screen-free devices (WHOOP, Oura) rely entirely on a companion app for viewing any of this data, while Garmin, Apple Watch, and Fitbit display key metrics directly on-device.
How to Interpret Fitness Tracker Data
With so much data at your fingertips, it’s easy to get overwhelmed. The key is not to chase perfection but to focus on trends over time. Your tracker might not always be precisely accurate, but it’s very good at showing patterns. If you notice your sleep quality is consistently poor or your HRV is trending down, that’s valuable information you can act on — even without lab-grade precision.
It’s also important to remember that your body is the ultimate data source. If you feel exhausted even when your tracker says you’re “ready,” listen to your body. Technology is a tool, not a dictator.
The Best Smartwatch for Fitness Metrics: Garmin vívoactive® 6
To truly connect your training data with recovery, performance, and nutrition, you need real-time, accurate feedback. That’s where a dedicated smartwatch for fitness tracking becomes a game changer, allowing you to monitor key metrics automatically and make smarter, data-driven adjustments to your workouts and overall health strategy. The Garmin vívoactive® 6 is the one most popular and best selling smartwatches for fitness and health metrics.

Garmin vívoactive® 6
4.4 Stars (1,800 Reviews)
- Health and Fitness GPS Smartwatch
- AMOLED Display
- Up to 11 Days of Battery
References
¹ Paluch AE, Gabriel KP, Fulton JE, et al. (2021). Steps per day and all-cause mortality in middle-aged adults in the Coronary Artery Risk Development in Young Adults Study. JAMA Network Open. 4(9):e2124516. https://pmc.ncbi.nlm.nih.gov/articles/PMC8417757/
² Chow HW, Yang CC. (2020). Accuracy of optical heart rate sensing technology in wearable fitness trackers for young and older adults: validation and comparison study. JMIR mHealth and uHealth. 8(4):e14707. https://pmc.ncbi.nlm.nih.gov/articles/PMC7218601/
³ Shcherbina A, Mattsson CM, Waggott D, et al. (2017). Accuracy in wrist-worn, sensor-based measurements of heart rate and energy expenditure in a diverse cohort. Journal of Personalized Medicine. 7(2):3. https://pmc.ncbi.nlm.nih.gov/articles/PMC5491979/
⁴ Hirshkowitz M, Whiton K, Albert SM, et al. (2015). National Sleep Foundation’s updated sleep duration recommendations: final report. Sleep Health. 1(4):233–243. https://pubmed.ncbi.nlm.nih.gov/29073398/
⁵ Schyvens AM, Van Oost NC, Aerts JM, et al. (2024). Accuracy of Fitbit Charge 4, Garmin Vivosmart 4, and WHOOP versus polysomnography: systematic review. JMIR mHealth and uHealth. 12:e52192. https://pubmed.ncbi.nlm.nih.gov/38557808/
⁶ Frontiers in Cardiovascular Medicine. (2025). Heart rate variability: a multidimensional perspective from physiological marker to brain-heart axis disorders prediction. https://doi.org/10.3389/fcvm.2025.1630668
⁷ Strasser B, Burtscher M. (2018). Survival of the fittest: VO2max, a key predictor of longevity? Frontiers in Bioscience (Landmark Edition). 23(8):1505–1516. https://pubmed.ncbi.nlm.nih.gov/29293447/
⁸ Ibrahim AH, Beaumont CT, Strohacker K. (2024). Exploring regular exercisers’ experiences with readiness/recovery scores produced by wearable devices: a descriptive qualitative study. Applied Psychophysiology and Biofeedback.49(3):395–405. https://pubmed.ncbi.nlm.nih.gov/38668986/
This article is intended for general informational and educational purposes only. It does not constitute medical advice, diagnosis, or treatment. Fitness tracker data — including heart rate, SpO2, sleep, and stress metrics — should not be used to self-diagnose medical conditions. If your device flags irregular readings or you experience symptoms of concern, consult a qualified healthcare provider rather than relying on consumer wearable data alone. Device accuracy varies by brand, model, and individual physiology, and figures cited in this article reflect published research at the time of writing.
Leave a Reply